


New on LowEndTalk? Please Register and read our Community Rules.
All new Registrations are manually reviewed and approved, so a short delay after registration may occur before your account becomes active.
All new Registrations are manually reviewed and approved, so a short delay after registration may occur before your account becomes active.
Bind DNS Query logging and Graph Charting (GNUPlot)

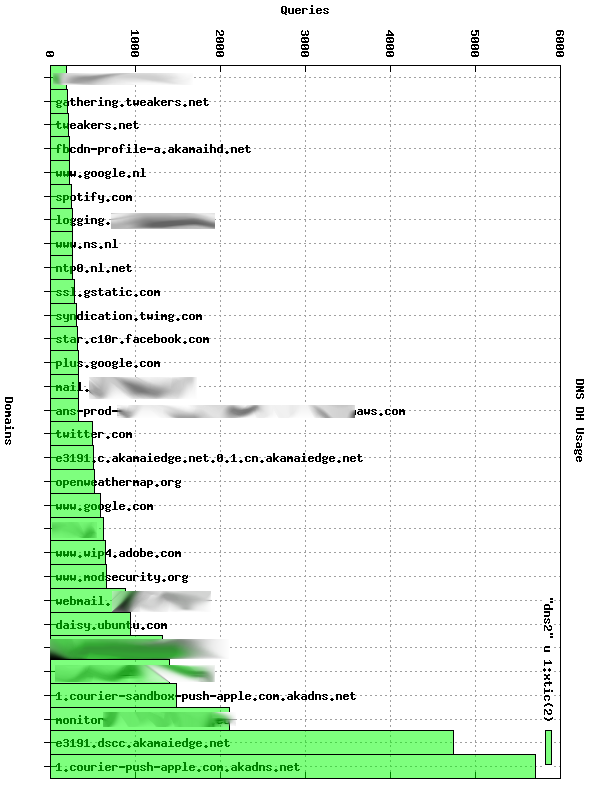
I was fixing some DNS Issues, and for that I turned on Query Logging in Bind. This resulted in a nice dataset, and with some Awk and GNUPlot magic, the above image is the result.
See the tutorial: https://raymii.org/s/software/Bind-GNUPlot-DNS-Bar-Graph.html
Does anyone have experience with GNUPlot, because for me to get the horizontal image, I used convert. Does GNUPlot only do vertical bar graphs, or am I doing it wrong? With Matlab or R this would be easy, but since I needed something quick and simple...

Comments
You've already found the best option with convert. As far as I know there is no direct, non-tricky way of doing it in gnuplot directly. You can try to play with boxxyerrorbars.
I did that, because my google searches turned that up, but it went hay wire and after half an hour of struggling I decided to use convert...