


New on LowEndTalk? Please Register and read our Community Rules.
All new Registrations are manually reviewed and approved, so a short delay after registration may occur before your account becomes active.
All new Registrations are manually reviewed and approved, so a short delay after registration may occur before your account becomes active.
HetrixTools Agent Using a Lot of CPU
 Crunchy7761
Member
Crunchy7761
Member
in General
Anyone else notice this? On a decent cpu its not too noticeable but on a cheap vps with bad cpu it uses way more than it should.
example from a 2 core vps with 1000 gb6 multicore score
Anyway I installed beszel and it uses way less cpu. What alternatives do yall recommend?

Comments
That graph looks like a chicken")
Anyway, it's just a shell script, unless you are running it on a total potato with huge CPU steal, it's as light as it can possibly be.
1000 multicore score? That is like a 10+ years old i3? Then why are you surprised?
Title: HetrixTools Agent Using a Lot of CPU
Look inside: 6%
I found the same issue, I was basically ask, indirect, to debug his agent, so I just uninstalled it.
The bad part is, hetrixtools isn't displaying its own usage e.g the cpu load its causing.
Its not on every system, its under certain conditions.
I started using zabbix about a year ago, but still have some machines in hetrixtools as well because it's quite a nice interface so I never bothered removing it.
Maybe 6 months ago, I noticed that one machine that has been running hetrixtools for about 4 years, their shell script suddenly started using about 30% CPU on a 1-CPU VPS. No matter how many times I killed it, updated, restarted etc, it still spiked again about an hour later and stayed like that. As I have zabbix, I just removed the hetrix agent rather than debugging it. But I've definitely seen this issue too.
i use the php agent variant, the cpu usage on an iddle cheap chicken is never above 2% with that script. Maybe switch to the php agent. Also i use an interval of 5 minutes.
I've been using the agent for a long time and never had any issues, but now I'm intrigued and so am going to have also check to see how much CPU it's using.
@HBAndrei
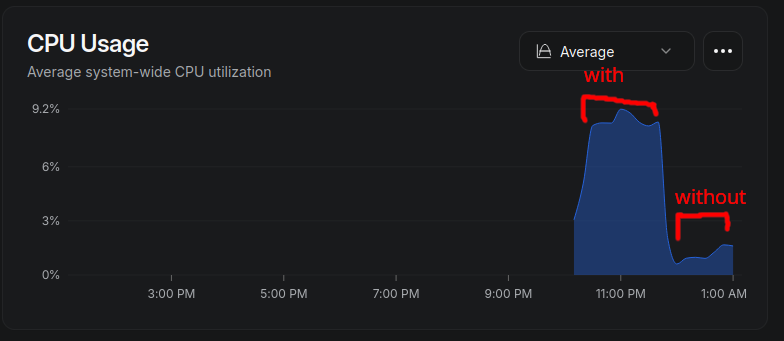
i've monitored with beszel before
same vps
with hetrixtools constantly using 10% cpu usage
with fivenines constantly using 2% cpu usage
beszel only always below 0.2% cpu usage
Beszel's agent is compiled in go and iirc the other two use python and/or php
Its just a question of low cpu computing power + not using a language known for good performance tbh. Just look for stuff with compiled / golang agents, and you'll fix your problem.
@Crunchy7761 please open a support ticket and we'll work on identifying and fixing the issue if possible.
Our agent has evolved quite a lot over the years, thanks, in no small part, to user feedback. Unfortunately, we can't account for all possible edge cases. As you've already mentioned, it's not a regular occurrence. On the overwhelming majority of servers, the agent has very decent resource usage. This is why you were asked for some debug feedback so we can figure out your specific edge case and see if we can fix it.
Our agent reports the entire system metrics, including the resources it uses itself to collect the metrics.
Cheers.
But not the CPU load it causes.
I already ticketed you when I recall correctly.
The end was, you couldn't reproduce it, I could reproduce it on multiple machines.
Which essentially would make me debug it but I wasn't in the mood.
Some calls cause high system load, under certain circumstances, not on all systems, which isn't displayed/included by hetrix itself.
Probably because it happens during these calls, so hetrix isn't able to include it, because doesn't seem to be aware what load the calls itself cause under certain circumstances.
I have not noticed an increased CPU load when running hetrixtools but I'm using a less aggressive sampling frequency (10 seconds rather than the default 3) in
/etc/hetrixtools/hetrixtools.cfg, lineCollectEveryXSeconds=.beszel is nice but i switched to Komari Monitor it just works in docker for my use case imo
pretty common in lowendtalk
its about 8-9% and that is insanely high percent to be dedicating to just monitoring resources
I've used HetrixTools for a long time, probably since very early on. I've never noticed any issues with CPU usage and I use the actual server agent for resource monitoring. I checked a few and usage is only 0.5-0.8% CPU on it. These are all Ryzen/Epyc but I wouldn't think the older CPUs would be that much worse, like 10% that's crazy.
Anyway best bet is to just use snmp and a tool like librenms/zabbix/etc. I also run Librenms.
We manage a decent number of servers across various hardware generations and have seen this same pattern — the shell-based HetrixTools agent hits harder on older/weaker CPUs with high steal. A couple of things that helped us before switching some nodes over:
CollectEveryXSeconds=10in/etc/hetrixtools/hetrixtools.cfg— the default 3-second polling is aggressive for low-spec VMs. Bumping to 10 dropped CPU usage noticeably on constrained boxes.For anything seriously underpowered, Beszel's Go agent is the right call — sub-0.2% is hard to argue with. We've also had solid results with LibreNMS over SNMP when managing larger fleets where you want consolidated dashboards rather than per-node agents.
With these suggestions, the over whelming majority are to decrease the collection frequency. But that doesn't really explain why it's using so much CPU in the first place. If it's taking 30% CPU using every 3 seconds, it'll still be 10% using every 10 seconds.
And there definitely is some kind of issue somewhere. I had 15 monitors before on a variety of machines, from dedis to really crappy VPS with GB5 scores down to around 600. The one that started suddenly consuming about 50% CPU was on one scoring around 900, and had previously consumed negligible CPU for a couple of years.
But anyway, I'm using zabbix now. Not noticed any problems with that, even though I prefer the way hetrix presents its information.