


New on LowEndTalk? Please Register and read our Community Rules.
All new Registrations are manually reviewed and approved, so a short delay after registration may occur before your account becomes active.
All new Registrations are manually reviewed and approved, so a short delay after registration may occur before your account becomes active.
How are you monitoring your infrastructure?

Curious about what everyone is using these days to monitor their servers and infrastructure?
Do you outsource to the likes of Nixstats, Site24x7, or HetrixTools?
Or "self-monitor" with something like Zabbix, Checkmk, Prometheus+Influx+Grafana, PRTG, Observium, etc...
If you do it in-house, are you monitoring from multiple locations? If so, how?
PS - I'm not asking about website uptime monitoring like pingdom and uptimerobot.

Comments
The majority of actual resource monitoring or usage alerts are custom bash scripts that I have setup on every system to send me Pushover notifications, but can be rewritten to send notifications via any command/api. The scripts check things like drive use for partitions, software RAID status, CPU usage, etc.
Otherwise, I have a few small things, one being PhpServerMonitor running on AWS that checks TCP/ICMP for all systems and sends Pushover to me as well if one is down (which can also be setup to send SMS, email etc.) I've used PhpServerMonitor forever, it's a very useful small script.
I have HetrixTools (service agent) setup on important systems like hypervisors that monitors all resources as well (as a second backup to the custom bash scripts I have) to monitor all resources as well.
Public status page I run (https://status.extravm.com) is UptimeKuma, another great open source tool, which I run on a small VPS on my Dallas location.
We use Nodeping for up/down alerts and to generate our status page, but also Nagios for internal monitoring (load, raid health, disk space, etc). We use Observium for network monitoring.
I think we've generally been happy with Nodeping from a monitoring perspective but I dont really like the status page
I'd really suggest looking at UptimeKuma, it really is great and has many features, even niche stuff like CloudFlare tunneling so the status page IP isn't public. But that's of course if you're fine with the public status page server checking from a single location.
Personally I use Icinga, Grafana and Graylog to keep track of things. It's amazing how easy it is to actually make it fully automatic.
At work, most of the major players use Nagios/Naemon, Icinga or SCOM, backed by Grafana, Kibana or Squared Up for visualization. Some Observium and LibreNMS in networks with lots of networking equipment.
I see some op5 and PRTG, but it feels like they are getting increasingly rare.
I like and use HetrixTools, my only complaint is the innability to setup default notifications - they have to be set per client, which is annoying.
I guess you're exporting everything from Icinga to Grafana?
I've tried Nagios and it's various flavours a few times over the years, and I can't seem to find any love for it - it just feels so clunky. Checkmk wasn't bad when I last tried it.
PRTG is good, but their Windows only approach I think is what killed them off.
I was thinking of leaning towards Nixstats but the webpros aquistion put me off...
Well, kind of. The way my personal environment is setup I simply run a single one-liner every time I setup a new VPS. This adds it as an object in Icinga and from there I have various other system that queries the Icinga API and integrate the new VPS into whatever it needs to be integrated in. Things like ssh-keys, vpn tunnels, backup etc are all fully automated, I simply deploy the VPS and paste a single command into cli.
Depending on what groups in Icinga I add the new VPS to, it will deploy different checks. Some are done by Icinga and then exported to Grafana, others are done locally on the machine with node exporter or telegraf and then fetched by Prometheus or sent to Influx and then used by Grafana.
Most people find Nagios clunky until they truly understand it.
It was never made for users hacking away in cli editing textfiles trying to add hosts or services, it is supposed to be automated. I maintain a bunch of pretty big Nagios installations, and I can honestly say that the majority of them I have not even logged into for years, they are all fed and configured via various API's or automated scripts.
Have you tried Icinga? It's a Nagios core but with a different approach. The main idea is still automation, but it has a pretty good ui in the Director that makes it pretty easy even for beginners.
That, and the insane pricing. When you have thousands of devices it's not even funny any more.
BetterUptime for websites, just a simple GET, might change it to include some keyword to not say it's up if WP is showing a database error for example. It can do that.
For sever usage, RunCloud.io built in notifications.
Both of the above go to my email as well as Slack where I've got notifications on desktop & mobile.
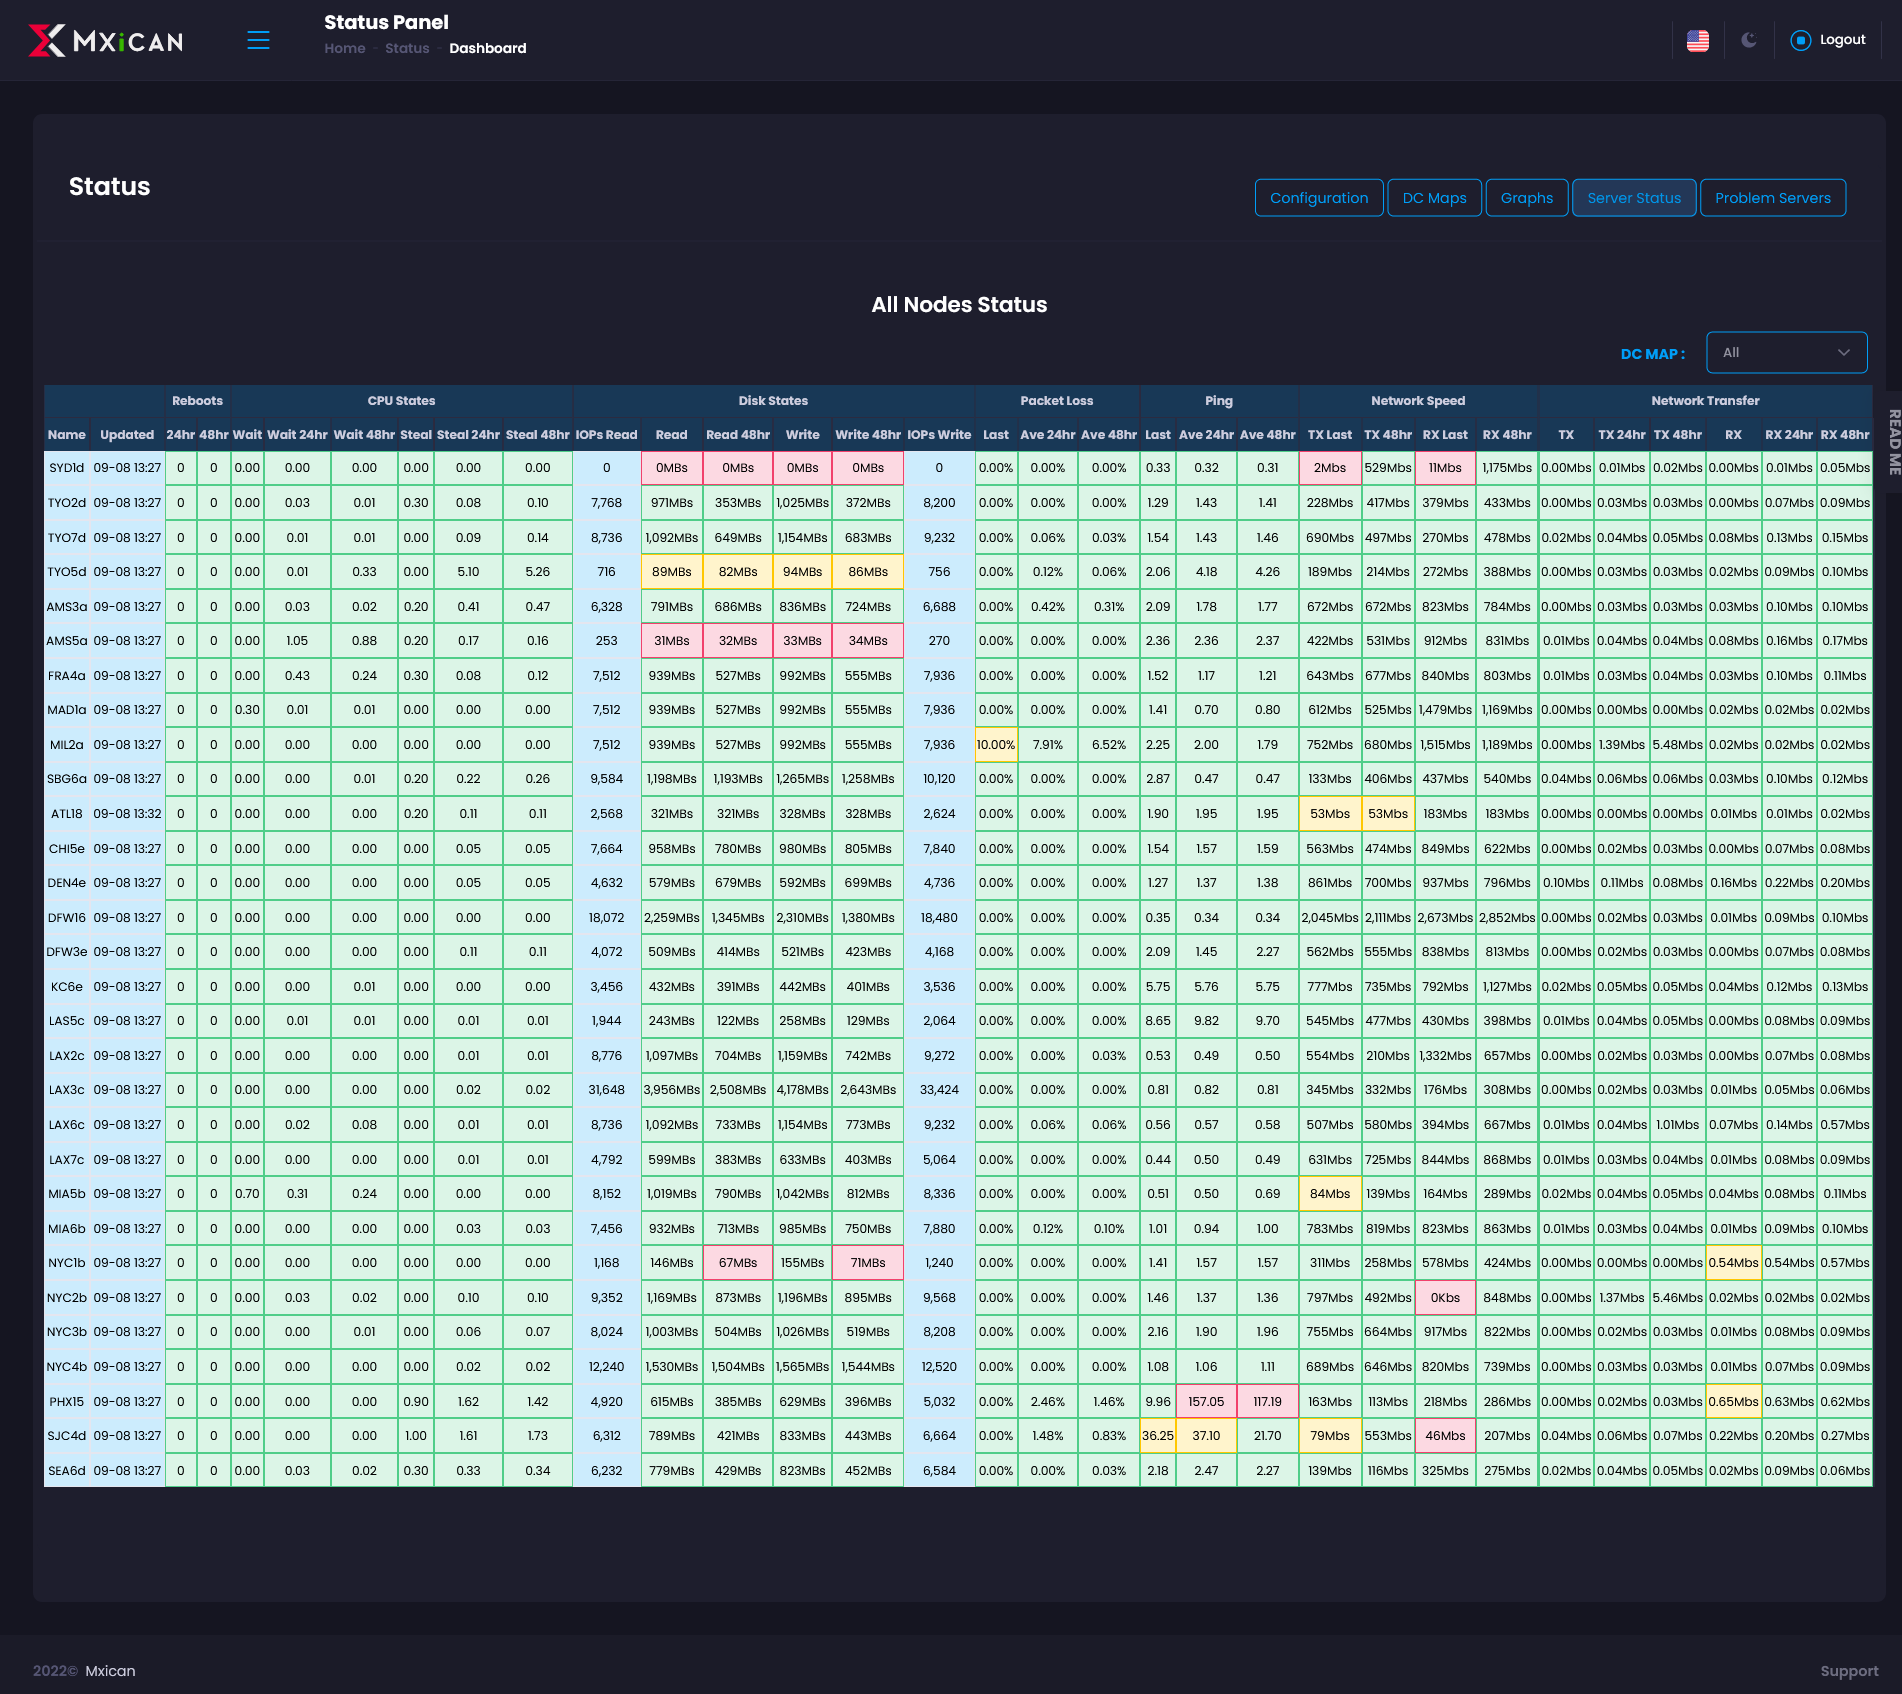
I roll my own, as I like them lite and customizable.
For monitoring server/VM states, CPU, disk, network and such.

For monitoring GeoCast DNS & http servers.
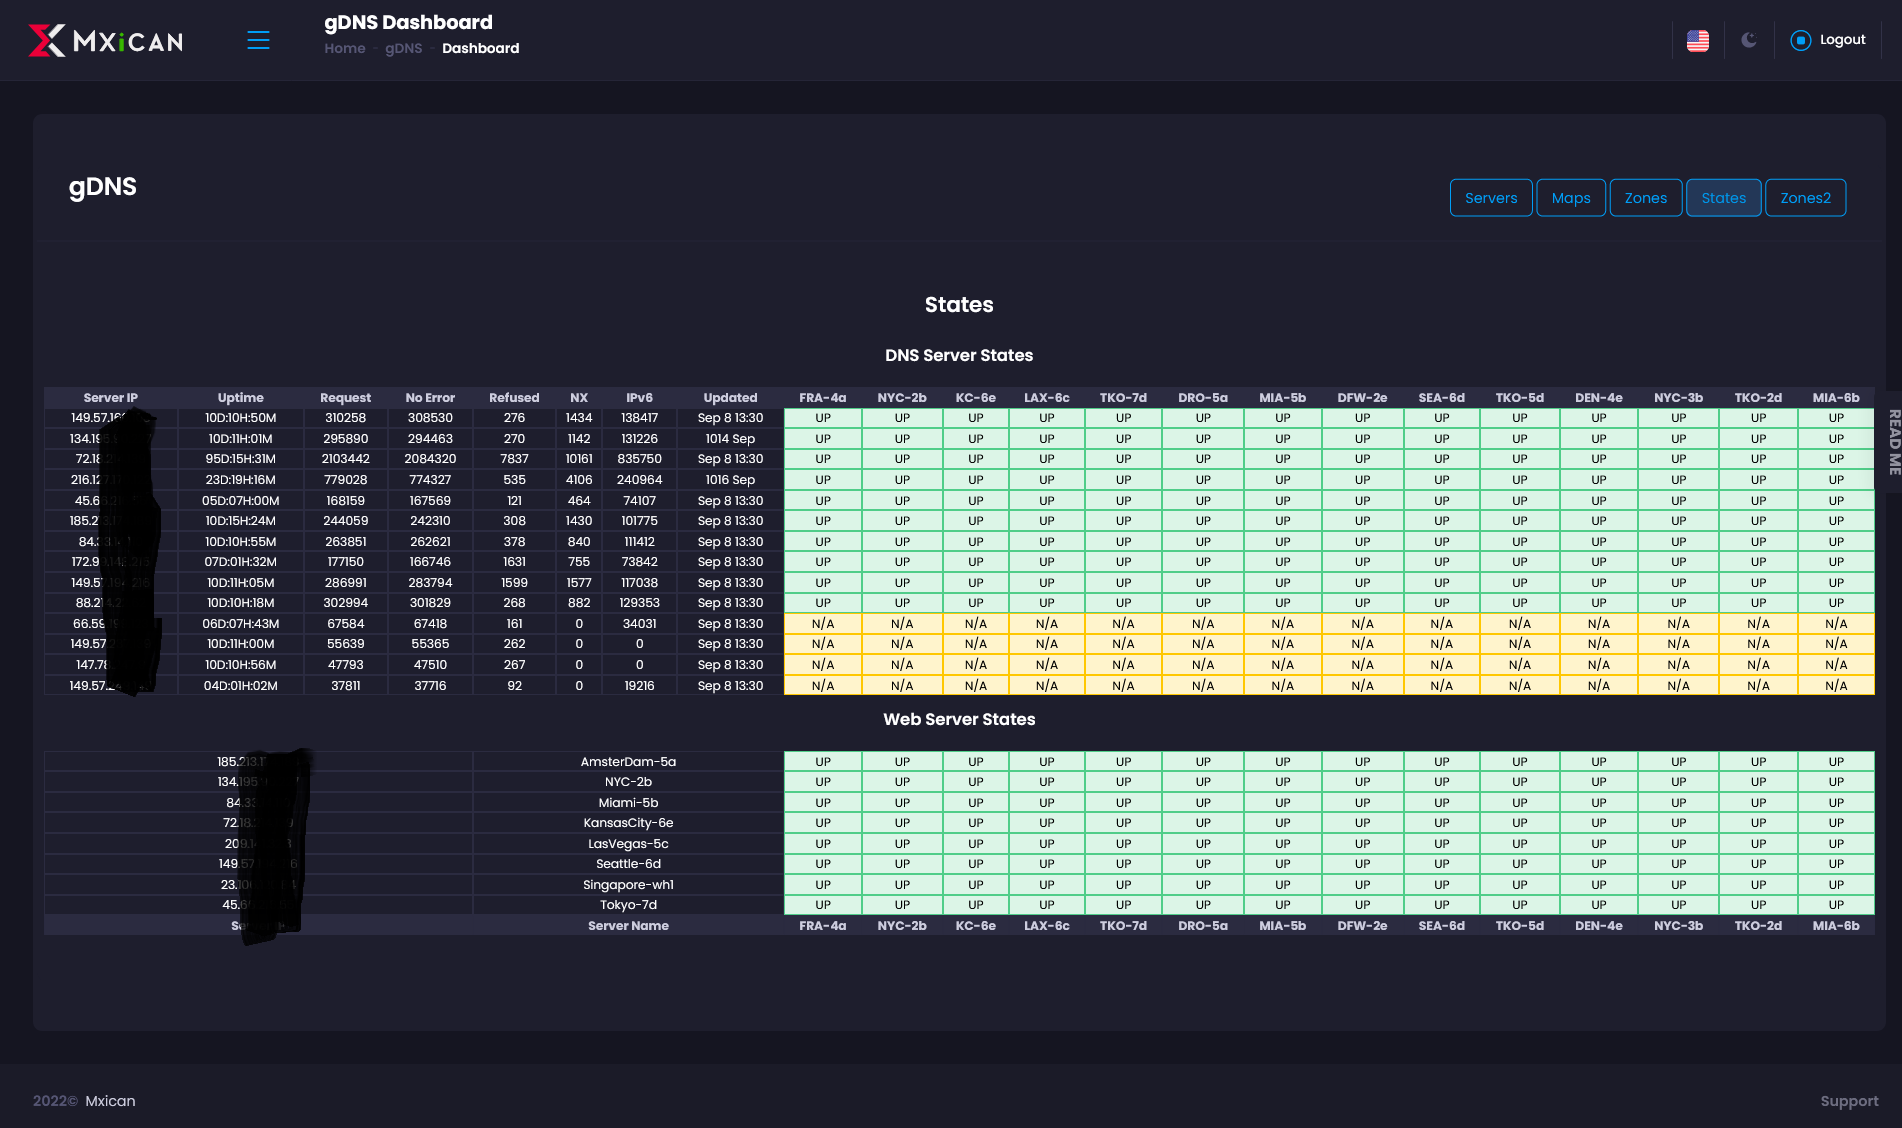
(N/A are setup but not currently active dns servers.)
The system sends email/SMS alerts when UP/Down status changes or CPU, disk, or network goes beyond limits set in configuration. It also automatically changes DNS to closest replacement http server.
I also monitor server synchronization, backups, firewall states, disk usage, services active, and service low/ave/high response times from 12 locations.") )
)
(no screen shots shown as this post is long enough already
@FrankZ looks cool!
What language did you build it in? Are you using agents?
That actually looks awesome.
Are you using a framework? What kind of frontend/backend? How do you pull metrics and where do you store them?
What's the daemon you use to get the information? SNMP? Something you rolled custom?
"What monitors the monitoring system?!"
Mad respect to you and your systems bud. This is solid.
For the purpose of this post, I just use LibreNMS (migrated from Observium). SNMPD handles everything I need and there are some customization you can do through it. Overall, it works.
@HalfEatenPie
How do you find monitoring servers with SNMP - how many hosts you monitoring?
About 50 or so.
It's easy to automate deployment (my server hosting bash script automatically handles everything) and then I just add it into the system.
For VPS: UptimeRobot.
Some are ICMP ping, some are TCP port 22.
I get an email when a machine becomes inaccessible.
If it doesn't come back in 30 minutes, I check manually.
When it reaches 3 hours, I open tickets.
When it reaches 24 hours, I open drama thread.
For HTTP service: UptimeRobot.
I get an email when a website becomes inaccessible.
If it doesn't come back in 30 minutes, I check manually.
For my own sites, I try to fix it.
For other's sites, I poke them on Slack.
For push-ups delivery network: self built monitor.
The monitor tests every router every 10 minutes.
When a router becomes inaccessible, it is automatically taken out of the rotation.
Client apps query the API for 4 nearest available routers, test their speeds, and pick the fastest one.
Thank you for your kind words.")
The panels are written with Perl, java script and html, I did not use any jquery or SQL. The agent install script is bash. The agent on each server/VM is Perl. All very lite. The 12 service monitors that gather service response times are also written in Perl and send the data to two duplicate panel servers.
I know Perl is old school, but I have been using it so long that I can do anything I want with it very quickly.
I'm primarily using CheckMK for uptime + resource monitoring.
If a higher granularity is needed, I'm combing it with Netdata.
Unfortunately, CheckMK lacks a public dashboard, which is why I'm still stuck with Uptimerobot.
Might switch to UptimeKuma at some point
@v3ng CheckMK looks pretty cool!
Are you using the distributed monitoring feature?
Do you know if for example it allows you to monitor server A from both locations 1 and 2 in one pane of glass?
I'm super happy with CheckMK, can totally recommend it.
They also have very extensive documentation and even YouTube videos in German + English if I remember correctly.
However I never looked into the distributed monitoring feature, that's a topic for another day")
I've actually never tried it, but you can use CheckMK as a direct datasource in Grafana. You should be able to easily build a dashboard exactly the way you want it with the data you already have.
https://docs.checkmk.com/latest/en/grafana.html
I was not aware of that feature, thank you!
If you check it out, please let me know what you find. Trying out checkmk and grafana integration has been on my todo-list for a long time since I use both products, just haven't got around to it yet.
Zabbix, UptimeKuma, HetrixTools.
How do you find Zabbix? Are you using it for just linux servers?
I use Hetrixtools, UptimeRobot and few custom-made scripts
I use zabbix only for linux servers with a custom template to monitor just what I'm interested in. Besides the database growing a bit too big, I'm really happy with it.
I used Newrelic for few months. Very powerful now free tool, but oh boy ... frequency of their mailing for every random crap is unbearable even after opting out for all the notifications, commercial offers and stuff, so I got rid of them.
For now I use uptimerobot (free legacy account with limit of 100 not 50 servers) and simple serverstatus.php port check script someone at LET wrote many many moons ago.
Does anyone still remember NodeQuery?
I used it for my private servers a few years ago and loved its simple interface.
We made our status page in-house (https://status.xeovo.com), because none of the paid/open source options would meet our needs.
After testing and tweaking settings we settle down with pinging all servers from two different locations.
If a server is down for 5 minutes from both locations status page rises alarms and the system notifies us and customers + auto-posting to Twitter and Telegram.
Our next goal is to add availability in regions with heavy censorship China, Russia, Belarus, and Turkmenistan. The tricky part is that we need ping from different ISP's + from residential IP's.
Probably gonna build custom solution on Raspberry Pi and offer free subscriptions if user can setup one at their homes")
I used to use it too a few years back. It was awesome then got expensive. Haven't tried it since.
NodeQuery was great - never found out why it died.
Nixstats I guess replaced it.
Can we tempt any more people/providers into sharing how they monitor their infrastructure? Especially accross multiple locations?
(I don't usually like tagging people but might resort to it 😅)
@XEOVO sounds really cool!
What technologies did you use to build it?