


All new Registrations are manually reviewed and approved, so a short delay after registration may occur before your account becomes active.
Unable to Find Cause of Random CPU Spikes

Hey,
I’ve been trying to debug this problem since almost a week now. So, this is a cPanel server with CloudLinux and LS. Randomly server load reaches above 200 (mostly 250) and becomes unresponsive.
Things I’ve tried so far:
Disabling SWAP
Making sure everything’s upto date
Scanning accounts for malwares/exploits (even with lve enabled)
Things I’m thinking to try:
Disable CloudLinux OOM killer
Trying Kdump
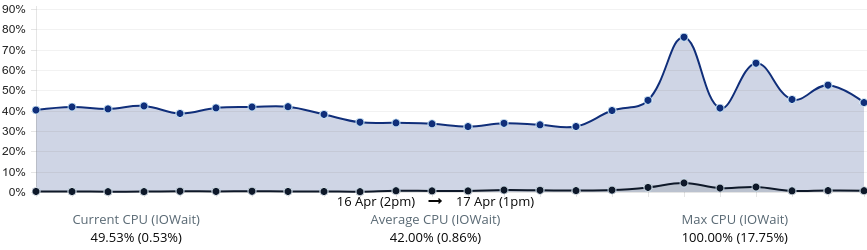
Problem is even when load is high, there are no processes using significant amount of CPU. So, I’m doubting high IO. Here is monitor log from one such event:
!-------------------------------------------- top 50
top - 04:28:10 up 3 days,  1:59,  1 user,  load average: 131.37, 139.55, 102.51
Tasks: 1206 total, 270 running, 934 sleeping,   1 stopped,   1 zombie
%Cpu(s): 17.1 us, 80.1 sy,  1.1 ni,  0.0 id,  0.2 wa,  0.0 hi,  1.5 si,  0.0 st
KiB Mem : 65768876 total,  1533392 free, 19082896 used, 45152588 buff/cache
KiB Swap: 10491896 total,     7776 free, 10484120 used. 34913172 avail Mem

  PID USER  PR  NI    VIRT    RES    SHR S  %CPU %MEM     TIME+ COMMAND
10245 mysql     26   6   18.7g   4.4g   3344 S 106.5  7.0   2586:18 /usr/sbin/mysqld --daemonize --pid-file=/var/run/mysqld/mys$
17068 root  20   0  271208  56792   1532 R  50.2  0.1  57:06.76 cxswatch - scanning
  192 root  20   0       0      0      0 R  42.9  0.0 102:07.40 [kswapd0]
 9242 mongod    20   0 1325612 249392   2772 S  37.7  0.4 367:50.58 /usr/local/jetapps/usr/bin/mongod --quiet -f /usr/local/jet$
28994 digikrea  20   0  338700  24912   3444 R  36.4  0.0   0:01.29 lsphp:/home/someacc/public_html/index.php
  193 root  20   0       0      0      0 R  34.2  0.0 112:06.32 [kswapd1]
17067 root  20   0  272140  58868   1432 R  33.8  0.1  57:32.19 cxswatch - scanning
IOTOP:
    !------------------------------------- iotop -b -n 3
    Total DISK READ :     184.97 M/s | Total DISK WRITE :    2016.29 K/s
    Actual DISK READ:      98.64 M/s | Actual DISK WRITE:      24.53 M/s
      TID  PRIO  USER     DISK READ  DISK WRITE  SWAPIN      IO    COMMAND
    27604 be/4 anotheracc    0.00 B/s    0.00 B/s  0.00 % 96.25 % lsphp:/home/anotheracc/public_html/wp-login.php
    28277 be/4 lyricsa1   20.52 K/s    0.00 B/s  0.00 % 53.80 % lsphp:e/anotheracc/public_html/anotheracc/index.php
    28520 ?err {none}    182.79 K/s    0.00 B/s  0.00 % 10.18 % {no such process}
I have noticed several cron jobs and php (index.php) processes running when such event occured (hundreds of them) but cron jobs are configured to run for every x minute in various accounts and have been like that for months.
Any pointers?

Comments
try to setup atop and take snapshots of the processes ... maybe that helps
https://haydenjames.io/use-atop-linux-server-performance-analysis/
Server has a cron job which logs this and some other details to file ever minute. I'll try this as well. Thanks!
It looks like it is caused by memory hogging and intensive swapping. Try increasing the amount of RAM on your server.
100% swap utilization! Your disks must be getting hit real hard.
Check top values of
and
Use it to track down swap usage, for instance
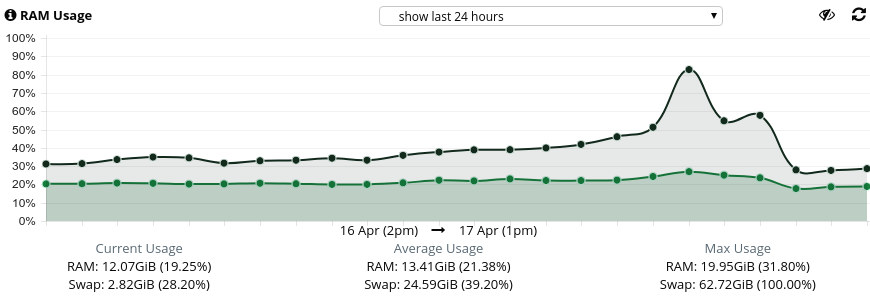
Peak swap use is 100%, but peak mem is only 32%. Looks like a memory leak. Is your system updated, especially mongodb and mysql? Also is
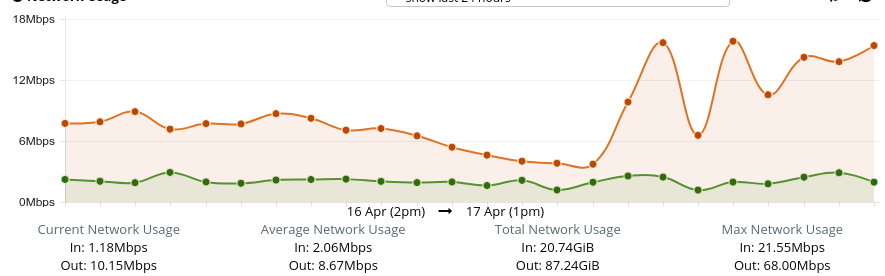
cat /proc/sys/vm/swappinesshaving a sane value (in 30 to 40 range). Don't disable swap or OOM killerMemory spike is correlated with network usage increasing. Is this some remote backup script? Some buggy backup script that takes forever to run would just eat up memory and free only on termination.
If it's a regular pattern in mem spiking, it could be a cronjob. Easier to pin down the culprit.
It’s possible your hosting provider is generating backups or performing some intensive tasks on the host node which is resulting in these performance issues.
I've completely disabled SWAP for now. Let's see if this is a memory problem because normally RAM usage stays around ~25% and even during this spike, it was around 24% but swap which is normally 0.x% peaked to 52%. For some reason either swap is being preferred or swappiness is not being followed? It's not even like server was running OOM so started preferring swap - ram was stable throughout.
@rincewind
They indeed are -
Kernel and other softwares are upto date. MySQL - 5.7
Swappiness was set to 10. Upon recommendation by cPanel and CloudLinux, I've disabled SWAP and OOM for now, lets see how it goes tomorrow.
I think this was just a coincident as several other times network usage was just normal. This specific log was wrote when backups were being run as well.
Not a regular pattern, totally random.
I appreciate you all taking time to write this")
P.S. I've configured atop, let's see what we find.
It's great seeing so many people offering suggestions to help you out!
Good luck finding that nasty bug/issue :P
Another thing to check is if your
tmpfsdirectories are getting full, i.e.,df -kh | grep tmpfs.perf record -a
perf report
it will tell you which syscall is causing 80% sy.
and which process call it (mongo, mysql, cxswatch).
Just wanted to update here, it’s been around a day and haven’t noticed it reoccur. Here are things I did:
Disabled SWAP
Disabled OOM killer
Disabled CXSWATCH (which was also spawning clamd)
If everything goes fine for another 24 hours, I’ll try enabling them one-by-one except for swap. Let’s see
Big thanks for everything for suggestions
Thanks, they are almost empty.
This is really helpful and interesting. I'll play around with it incase something similar happens in future.
Hey guys.
Since the issue was fixed, there has been lot of un-explainable webserver downtimes. Server’s working fine - php is working fine. LiteSpeed shows running but does not respond to any requests. Page keeps loading. Give it a few minute and it’s back up. Load to drops to 1 in the meantime.
Today, even SSH was unaccessible.
If someone with good reputation here can take a look at their price/cost, I’d be grateful.
so it's not fixed at all. disabling swap and oomkiller isn't a fix at all ;-)
maybe provide more info, what exactly you consider to be the fix (other then disabling the above). you probably still have the same problem as before (memory leak or whatever) but now instead of filling up swap and hogging IO that way, you just see other odd behaviour as a result
just a guess.
Have a look in syslog, that should give you some pointers. It probably failed to allocate memory since you disabled swap and as a result, the server was actively killing processes to get access to memory (syslog can confirm this). In the mean time, no single worker can do anything (not even accept your SSH connection), because it doesn't get any memory from your kernel.
Disabling swap is not a solution as pointed out by @Falzo. Though it will definitely help reducing the load put on the disks, the issue is still there: a memory hogging application.
Setting up atop is a good start. Basically, you need to find the PID who's doing immense memory allocation and then dump the procinfo of this PID to find additional information that can help you trace it down (e.g. filepath in the case of a PHP script).
I'd also like to point out that if you believe this could be caused by a PHP script but have not yet setup a sane memory limit you should consider doing so (https://www.php.net/manual/en/ini.core.php#ini.memory-limit).
Re-enable swap/OOM and find out what is using swap.
Thanks.
@OP What are you hosting ? Maybe your trafic / users generates spikes and that cause the symptoms you describe.
Thank you @Falzo, @solaire and others. Issue was with the Transparent Huge Pages (THP). Disabling OOM-Killer and swap might have prevented cpu overload perhaps caused due to it therefore there was some improvement.
I think enabling both should be fine now.