Howdy, Stranger!

It looks like you're new here. If you want to get involved, click one of these buttons!


Production server | What the heck?
New on LowEndTalk? Please Register and read our Community Rules.

All new Registrations are manually reviewed and approved, so a short delay after registration may occur before your account becomes active.

Production server | What the heck?

FlorinMarianFlorinMarian Member, Host Rep

A new day, a new post.

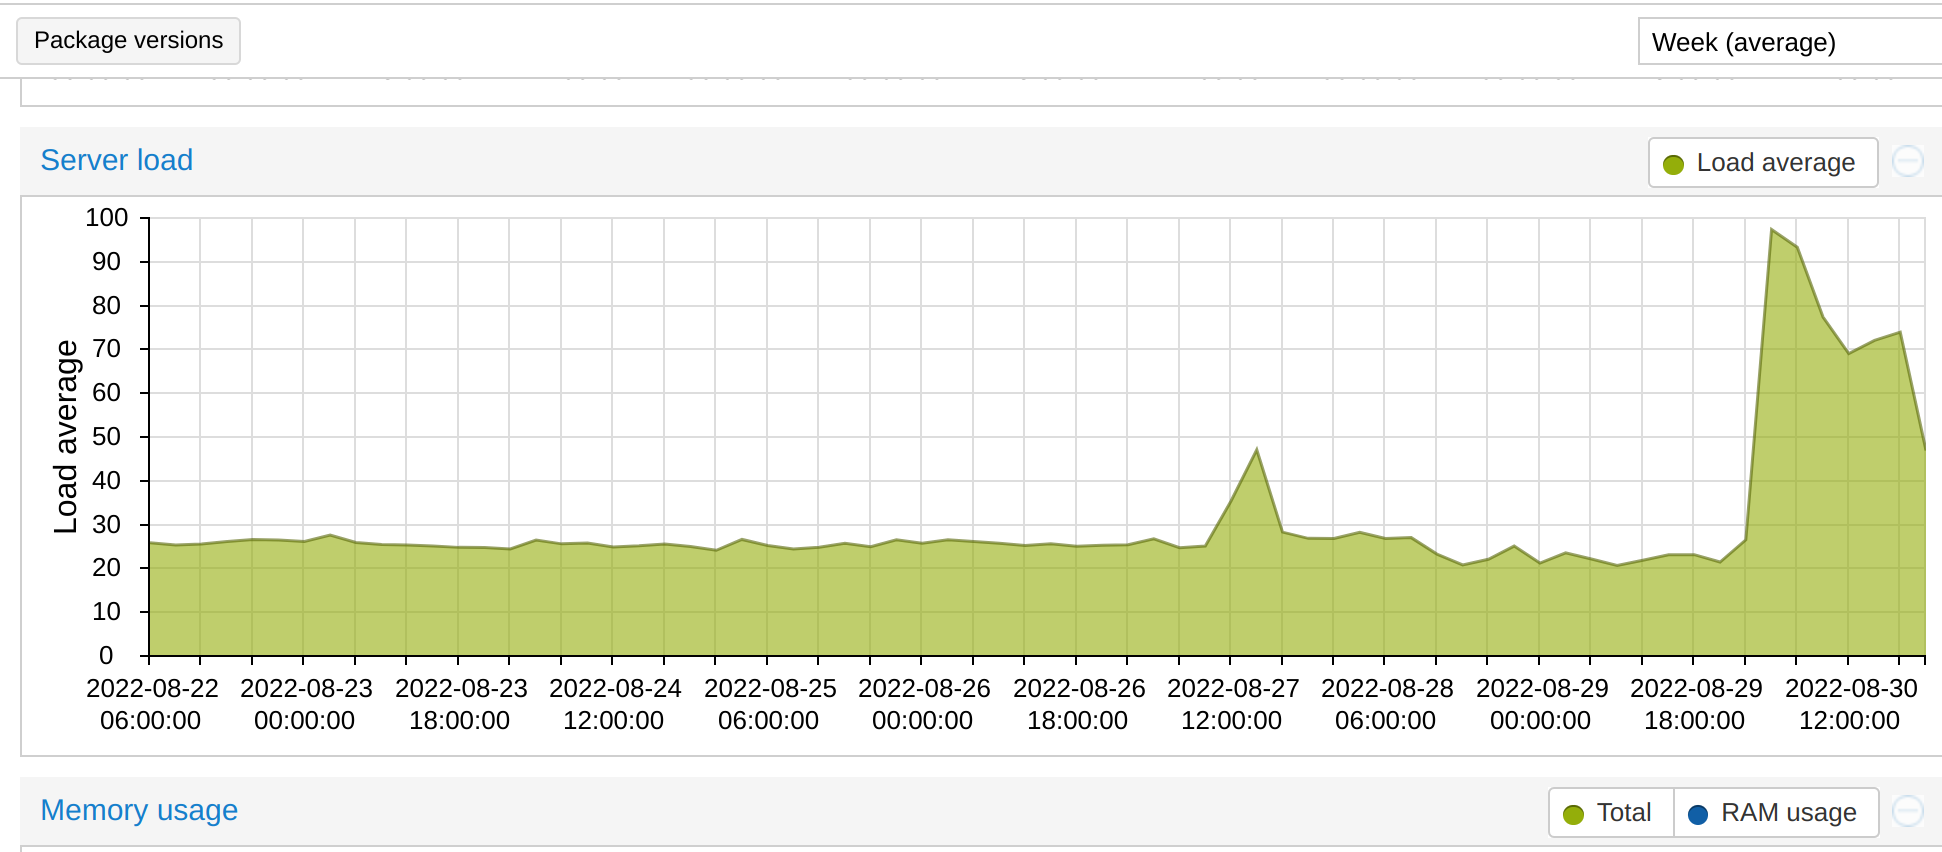
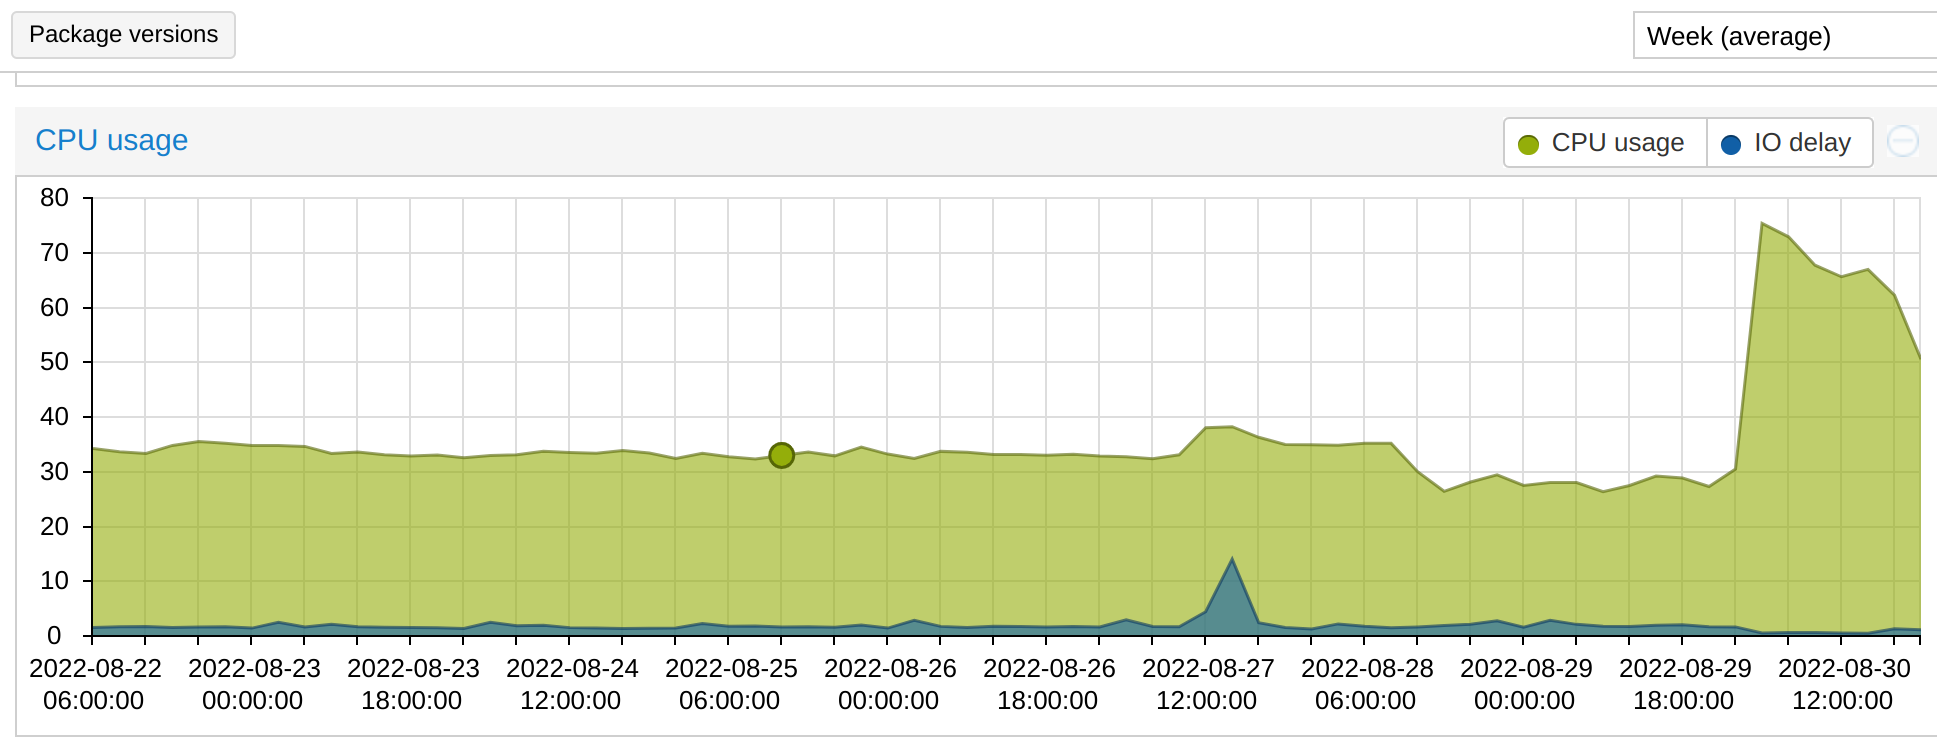
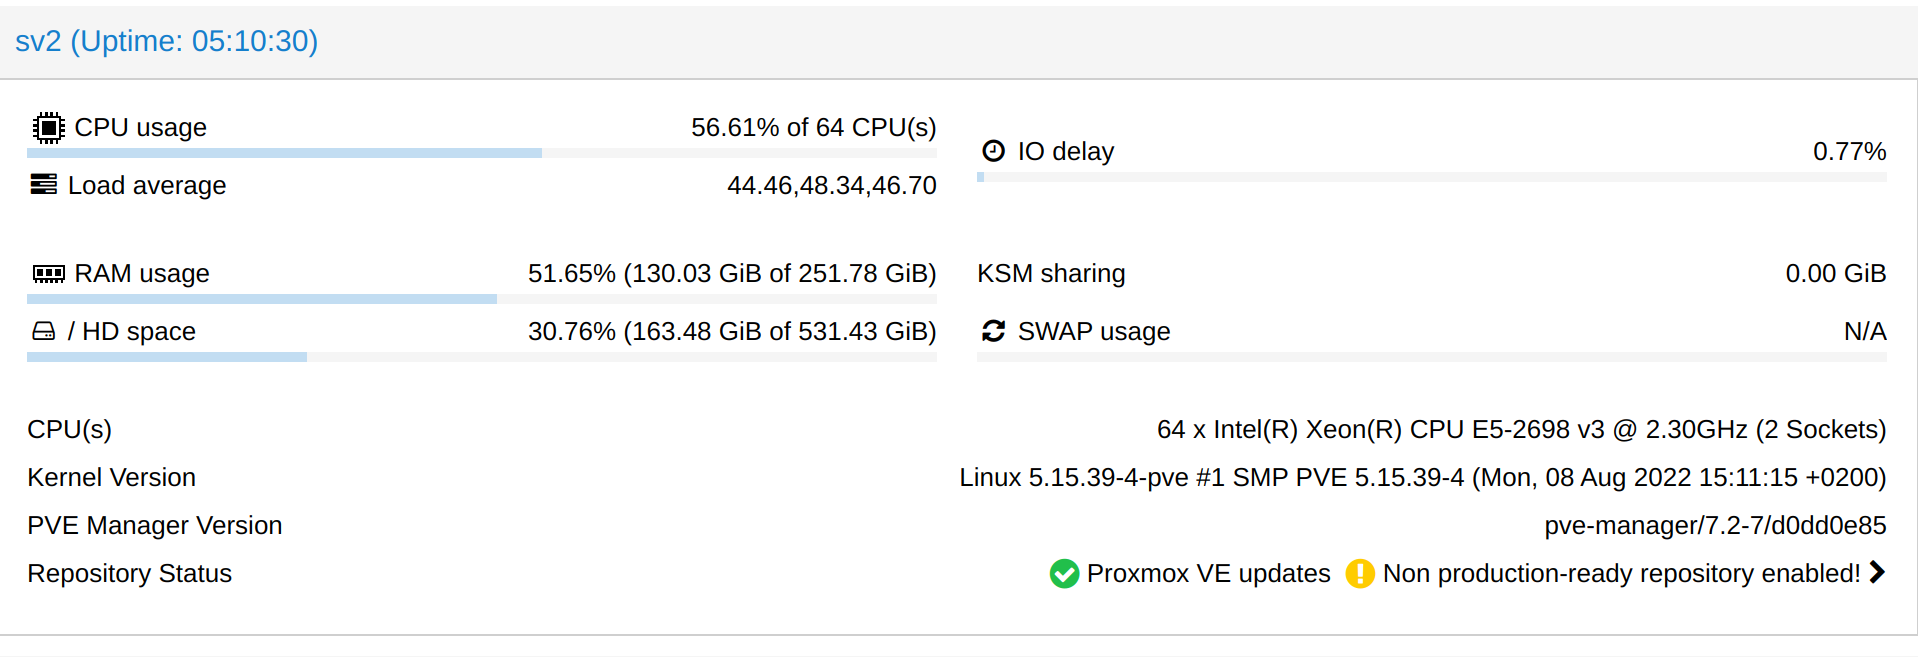
I woke up this morning with 5 tickets in which I was told that the KVM servers were moving deplorably and later I had to find out why (see the screenshots).


The big problem is that I was at the office (at work) all day and then I traveled by train, going back home only in the morning, in about 10 hours.

I know it is not ethical, professional, inspirational and well seen, but in order to solve the situation as quickly as possible tomorrow, I will tell you what I have already done and I did not manage to find the source of this problem:
1. I tested the RAM memory (nothing abnormal)
2. I checked the values in "smartctl" for each individual disk, there is no error on any of them
3. I checked the health status reported by proxmox for each ZFS pool, nothing abnormal there either.
4. I checked the temperature of the processors, nothing abnormal (below 60 degrees Celsius)

Any idea is welcome. (I try to impact customer services as little as possible, being an already critical situation)

Thank you!

«1

Comments

  • HxxxHxxx Member

    Did you looked at the list of processes?

  • yoursunnyyoursunny Member, IPv6 Advocate

    powersave strikes back.

  • FlorinMarianFlorinMarian Member, Host Rep

    @Hxxx said:
    Did you looked at the list of processes?

    Yes, nothing abnormal.
    I found out that most of VMs increased their usage at the same time, going from idle to 50-100%. Tried to figure out a pattern like a specific zfs pool but wasn't the case.

    @yoursunny said:
    powersave strikes back.

    Performance is already on.

  • HxxxHxxx Member

    How is the IO overall?

  • FlorinMarianFlorinMarian Member, Host Rep

    @Hxxx said:
    How is the IO overall?

    Quite low.
    Under 20Mbps according to iotop.

  • HxxxHxxx Member

    Looking for info at proxmox forum,
    one solution was to restart:

    pvestatd and udev

    daily.

    Other just attributed the issue to a CPU hardware, replacing the CPU's fixed the problem

  • FlorinMarianFlorinMarian Member, Host Rep

    @Hxxx said:
    Looking for info at proxmox forum,
    one solution was to restart:

    pvestatd and udev

    daily.

    Other just attributed the issue to a CPU hardware, replacing the CPU's fixed the problem

    We had today a node reboot but this didn't changed anything.
    Tomorrow when I'll get home, I'll take care of it.
    Thank you for your time!

  • HxxxHxxx Member

    Is this a soft raid? Could be a storage issue, maybe something not detected with smartctl. For example soft raid degradation, syncing, IF I'm not mistaken, soft raid could use the CPU intensively. Specially if HDD?

  • FlorinMarianFlorinMarian Member, Host Rep
    edited August 2022

    @Hxxx said:
    Is this a soft raid? Could be a storage issue, maybe something not detected with smartctl. For example soft raid degradation, syncing, IF I'm not mistaken, soft raid could use the CPU intensively. Specially if HDD?

    Good morning!
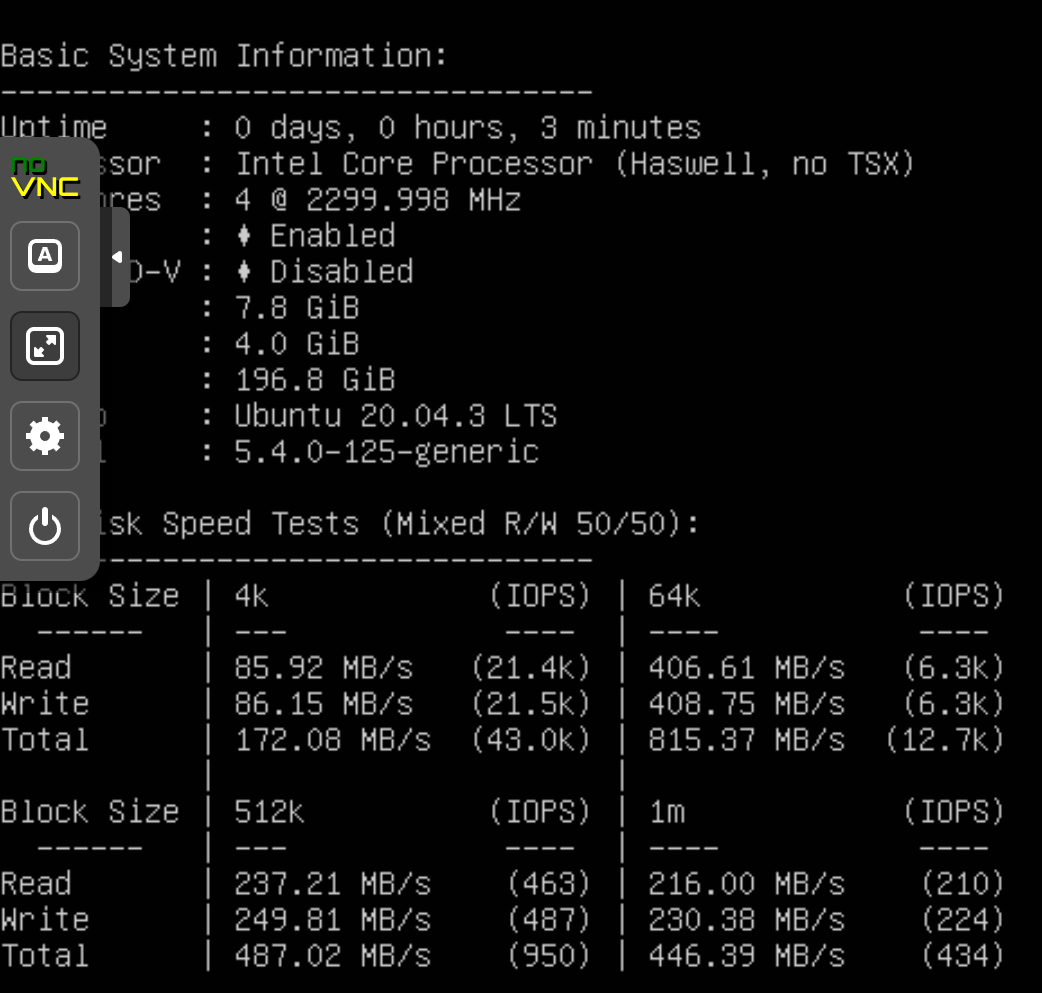
    With all VMs turned off, I discovered a rather dubious thing, namely that with only one VM turned on (regardless of whether we are talking about an SSD or HDD pool), the benchmark no longer displays a few GB but no more than 400MB read/write . In conclusion, for some reason, the server no longer uses ZFS cache, even if the minimum/maximum values remained the same (several tens of GB).

    SSD pool:

    curl -sL yabs.sh | bash
    # ## ## ## ## ## ## ## ## ## ## ## ## ## ## ## ## ## #
    #              Yet-Another-Bench-Script              #
    #                     v2022-08-20                    #
    # https://github.com/masonr/yet-another-bench-script #
    # ## ## ## ## ## ## ## ## ## ## ## ## ## ## ## ## ## #
    
    miercuri 31 august 2022, 06:28:16 +0000
    
    Basic System Information:
    ---------------------------------
    Uptime     : 0 days, 0 hours, 17 minutes
    Processor  : Common KVM processor
    CPU cores  : 2 @ 2299.998 MHz
    AES-NI     : ❌ Disabled
    VM-x/AMD-V : ❌ Disabled
    RAM        : 1.8 GiB
    Swap       : 0.0 KiB
    Disk       : 40.0 GiB
    Distro     : CentOS Linux 7 (Core)
    Kernel     : 3.10.0-1160.71.1.el7.x86_64
    
    fio Disk Speed Tests (Mixed R/W 50/50):
    ---------------------------------
    Block Size | 4k            (IOPS) | 64k           (IOPS)
      ------   | ---            ----  | ----           ---- 
    Read       | 90.94 MB/s   (22.7k) | 159.98 MB/s   (2.4k)
    Write      | 91.18 MB/s   (22.7k) | 160.82 MB/s   (2.5k)
    Total      | 182.13 MB/s  (45.5k) | 320.81 MB/s   (5.0k)
               |                      |                     
    Block Size | 512k          (IOPS) | 1m            (IOPS)
      ------   | ---            ----  | ----           ---- 
    Read       | 121.49 MB/s    (237) | 108.20 MB/s    (105)
    Write      | 127.94 MB/s    (249) | 115.41 MB/s    (112)
    Total      | 249.43 MB/s    (486) | 223.62 MB/s    (217)
    
    iperf3 Network Speed Tests (IPv4):
    ---------------------------------
    Provider        | Location (Link)           | Send Speed      | Recv Speed     
                    |                           |                 |                
    Clouvider       | London, UK (10G)          | 650 Mbits/sec   | 886 Mbits/sec  
    Online.net      | Paris, FR (10G)           | busy            | 857 Mbits/sec  
    Hybula          | The Netherlands (40G)     | 836 Mbits/sec   | 882 Mbits/sec  
    Uztelecom       | Tashkent, UZ (10G)        | 611 Mbits/sec   | 510 Mbits/sec  
    Clouvider       | NYC, NY, US (10G)         | 658 Mbits/sec   | 294 Mbits/sec  
    Clouvider       | Dallas, TX, US (10G)      | 577 Mbits/sec   | 607 Mbits/sec  
    Clouvider       | Los Angeles, CA, US (10G) | 615 Mbits/sec   | 662 Mbits/sec  
    
    Geekbench 5 Benchmark Test:
    ---------------------------------
    Test            | Value                         
                    |                               
    Single Core     | 248                           
    Multi Core      | 439                           
    Full Test       | https://browser.geekbench.com/v5/cpu/16979355
    

    HDD pool:

  • jackbjackb Member, Host Rep

    What model of ssds does the system have?

  • coldcold Member

    do you guys here get paid for the support you offer for his hosting company ?

  • FlorinMarianFlorinMarian Member, Host Rep

    @jackb said:
    What model of ssds does the system have?

    Proxmox itself running on Samsung 860 EVO and customers VMs Samsung PM893 1.92TB.

    @cold said:
    do you guys here get paid for the support you offer for his hosting company ?

    But those like you who search on google for solutions to their problems and find solutions following the discussions of others, are they paid well?

    Thanked by 1Madcityservers
  • @cold said:
    do you guys here get paid for the support you offer for his hosting company ?

    Its the provider asking for guidance. Im also interested what could cause this so its a good topic.

  • Did you look at each virtual machines graph to see if any of them used a lot of CPU starting a few days ago (week graph)

  • FlorinMarianFlorinMarian Member, Host Rep

    @Harmony said:
    Did you look at each virtual machines graph to see if any of them used a lot of CPU starting a few days ago (week graph)

    The whole problem appeared around 01:30 UTC+3, a day ago.
    Among the affected machines (more than 50% being affected) there is also one of my git servers which both before the problem appeared and after it was idling and suddenly the permanent consumption of the CPU had reached 50-100%, without had processes that consume those resources.
    It is clear to me after doing the same benchmark on the same VM that the storage is 20-30 times slower, ZFS cache no longer having an effect but even without it, I have too few iops. (several hundred, being the only VM that consumes storage)

  • jackbjackb Member, Host Rep
    edited August 2022

    @FlorinMarian said:

    @jackb said:
    What model of ssds does the system have?

    Proxmox itself running on Samsung 860 EVO and customers VMs Samsung PM893 1.92TB.

    @cold said:
    do you guys here get paid for the support you offer for his hosting company ?

    But those like you who search on google for solutions to their problems and find solutions following the discussions of others, are they paid well?

    PM893 probably won't get as bad, but the evos will go to a crippling level of performance if you have allocated the whole drive and don't do trim passthrough (often not supported in software caching).

    To confirm or rule out assuming you've got a raid configuration for your SSD caching, drop a single SSD from the array and secure erase it; once it's done - readd to the array. Then do the other drive.

  • LeviLevi Member

    Clearly someone has launched YABS on cron. On a serious note: you deploying ZFS? If yes, read documentation on proper debug. Probably scrub? Out of cache? It is your job to do.

    Thanked by 1yoursunny
  • FlorinMarianFlorinMarian Member, Host Rep

    @jackb said:

    @FlorinMarian said:

    @jackb said:
    What model of ssds does the system have?

    Proxmox itself running on Samsung 860 EVO and customers VMs Samsung PM893 1.92TB.

    @cold said:
    do you guys here get paid for the support you offer for his hosting company ?

    But those like you who search on google for solutions to their problems and find solutions following the discussions of others, are they paid well?

    PM893 probably won't get as bad, but the evos will go to a crippling level of performance if you have allocated the whole drive and don't do trim passthrough (often not supported in software caching).

    To confirm or rule out assuming you've got a raid configuration for your SSD caching, drop a single SSD from the array and secure erase it; once it's done - readd to the array. Then do the other drive.

    We have disk pools from 4 different categories:

    • 3TB HDDs
    • 4TB HDDs
    • EVO SSDs
    • Enterprise SSDs
      All are slow and currently I suspect that the problem may be with the "LSI SAS 9305-16i HBA - Full Height PCIe-x8 SAS Controller" card, which would be to blame.
  • FlorinMarianFlorinMarian Member, Host Rep
    edited August 2022

    @LTniger said:
    Clearly someone has launched YABS on cron. On a serious note: you deploying ZFS? If yes, read documentation on proper debug. Probably scrub? Out of cache? It is your job to do.

    No VMs running, barely a reboot, 99% of RAM free and we don't have more than 450Mb RW via ZFS, and before we used to reach 10GB using the same configuration.

  • ralfralf Member
    edited August 2022

    @FlorinMarian said:

    @Harmony said:
    Did you look at each virtual machines graph to see if any of them used a lot of CPU starting a few days ago (week graph)

    The whole problem appeared around 01:30 UTC+3, a day ago.
    Among the affected machines (more than 50% being affected) there is also one of my git servers which both before the problem appeared and after it was idling and suddenly the permanent consumption of the CPU had reached 50-100%, without had processes that consume those resources.

    Hmmmm, that actually sounds a little familiar with the situation I have on my home router, which is the only place I run proxmox. About every 4-5 days one of the Linux guests at random starts consuming 100% of its CPU, still responds to pings but I can't ssh into it any longer presumably because of the 100% CPU usage. I've tried all the combinations of host type, video type, HDD type I can find, but it still happens all the time. Interestingly, the pfSense which is a BSD guess doesn't have these same issues (and yes, I've tried the exact same config as that for my Linux guests and they still failed with the 100% CPU).

    I've not had this issue with VMs anywhere else, but I use qemu/libvirt directly for all of those, so my suspicion is that it's some weird proxmox bug, but as it also uses qemu/libvirt under the hood, I'm not sure what it could be. So, I then put it down to just a hardware issue (this is the only VM host I have running on an Intel Atom) and live with rebooting those guests whenever I notice one is stuck.

    But it might be worth checking if you're up-to-date with proxmox patches and/or try downgrading if you've recently upgraded it. My proxmox that I'm having issues with has been running just under 2 months.

    It is clear to me after doing the same benchmark on the same VM that the storage is 20-30 times slower, ZFS cache no longer having an effect but even without it, I have too few iops. (several hundred, being the only VM that consumes storage)

    I've read that ZFS, whilst being incredibly good in the normal case, can be quite hard to debug at times when something goes wrong. If you're new to ZFS, it's almost certainly considering this as the suspect more and trying to find out exactly what it's doing.

  • coldcold Member

    @FlorinMarian said:

    @jackb said:
    What model of ssds does the system have?

    Proxmox itself running on Samsung 860 EVO and customers VMs Samsung PM893 1.92TB.

    @cold said:
    do you guys here get paid for the support you offer for his hosting company ?

    But those like you who search on google for solutions to their problems and find solutions following the discussions of others, are they paid well?

    I ask mostly support if i have a problem...

  • This is the best time to buy proxmox subscription

    Thanked by 1Erisa
  • Check iptraf-ng to see if anyone running UDP flood

  • FlorinMarianFlorinMarian Member, Host Rep

    @lowendclient said:
    Check iptraf-ng to see if anyone running UDP flood

    No UDP ports are open with all VMs stopped and also iotop won't report any abnormal RW activity.

  • amarcamarc Veteran

    Why are you using ZFS with HW RAID (and how to be honest?) when even ZFS advises against it ?

  • yoursunnyyoursunny Member, IPv6 Advocate

    Mentally strong people disable RAID and use separate ext4 partition on each disk.

  • FlorinMarianFlorinMarian Member, Host Rep

    @amarc said:
    Why are you using ZFS with HW RAID (and how to be honest?) when even ZFS advises against it ?

    I don't use HW RAID configuration.

  • emgemg Veteran

    Mentally strong people run RAID 0 (striped) with many drives and no backup, right? :-o

    Thanked by 1yoursunny
  • PulsedMediaPulsedMedia Member, Patron Provider

    @Hxxx said:
    Is this a soft raid? Could be a storage issue, maybe something not detected with smartctl. For example soft raid degradation, syncing, IF I'm not mistaken, soft raid could use the CPU intensively. Specially if HDD?

    IOWAIT increases if storage issue. IODELAY (IOWait) has remained low.

  • PulsedMediaPulsedMedia Member, Patron Provider

    Sounds a bit like some chip is overheating, likely the motherboard chipset or LSI controller. Are you able to turn of the host for say 30minutes to let it cool for a few moments? do you have local on-site access?

    I would remove the LSI and motherboard chipset heatsinks, replace paste and try again then.

    We've seen a lot of peculiar performance issues when motherboard chipset overheats, but i don't recall an issue with LSI HBAs needing repasting.

    Then again, might just be ZFS. We've had nothing but trouble with ZFS tbh. Tho, gave it a try again just few weeks ago and had some very interesting and unexpected benchmark results. Perhaps ZFS is finally maturing.

    Thanked by 2FlorinMarian ralf
Sign In or Register to comment.